DASHBOARD -
Premier League Data
Data Set: Press Here
Tableau File: Press Here
Overview:
This project demonstrates analysis and visualisation of Premier League player statistics using Tableau. The dashboard presents various player metrics, including goals scored, clean sheets, aerial battles, and more, providing insights into player and team performance across multiple seasons.
Key Skills Used:
• Data Visualisation: Creating insightful visualisations to compare player and club performance.
• Data Analysis: Using advanced Tableau features such as box plots, scatter plots, and ranking techniques.
• Dashboard Design: Building interactive dashboards for analysis and storytelling.
Dataset Description & Preparation:
The dataset includes 571 rows and 59 columns of player statistics, ranging from age and appearances to goals, assists, and fouls. The dataset used Python's BeautifulSoup to scrape this data from the official Premier League website up until 24/09/2020.
Why This Project is Worth Doing:
• Offers a comprehensive view of Premier League player performance using real-world data.
• Develop strong data analysis skills through building visualisations that highlight trends in player statistics.
• The dashboard is useful for football fans, analysts, and stakeholders interested in football performance metrics.
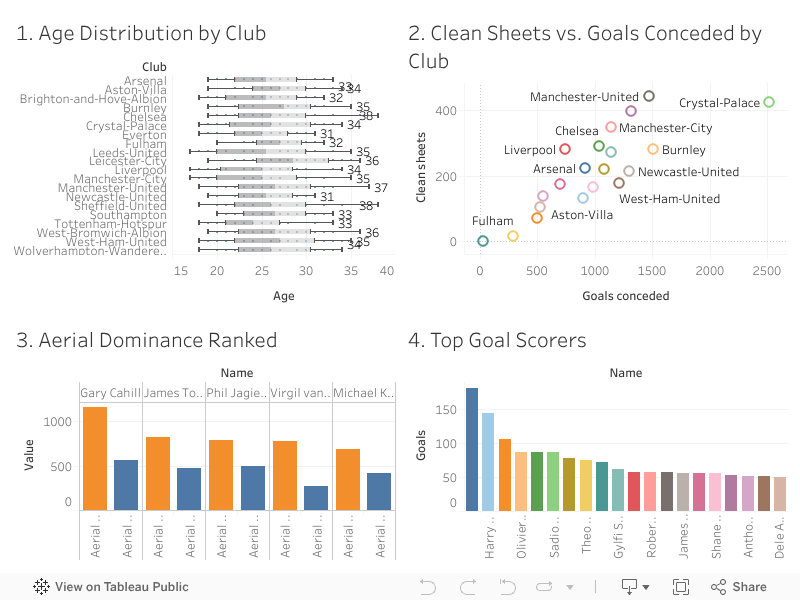
Visualisations:
1. Age Distribution by Club (Box Plot): Compares the spread of player ages across Premier League clubs.
2. Clean Sheets vs. Goals Conceded by Club (Scatter Plot): Shows defensive performance based on clean sheets and goals conceded.
3. Most Aerials Won - Top 5 Players (Bar Chart): Highlights the top players in aerial battles won and lost.
4. Top Players by Goals Scored (Bar Chart): Displays the leading goal scorers ranked from highest to lowest.
Final Dashboard:
This Tableau project allowed me to dive deep into Premier League player statistics and present data in a visually compelling and insightful manner. I enhanced my proficiency in building interactive dashboards that compare key player performance metrics like goals scored and clean sheets. Working with real-world football data strengthened my skills in data visualisation, and helped me understand how to showcase trends and insights that are meaningful for both football analysts and fans. The experience has reinforced my ability to design effective data-driven stories for performance evaluation and decision-making.